PMO lead
Keep twenty delivery budgets visible without chasing twenty spreadsheets.
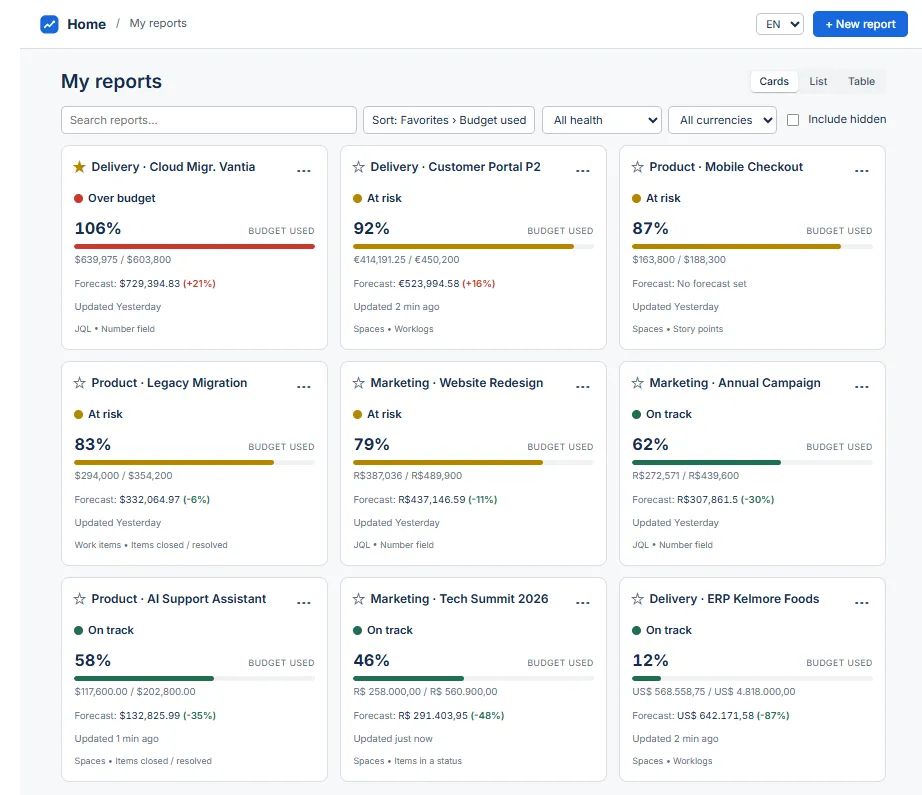
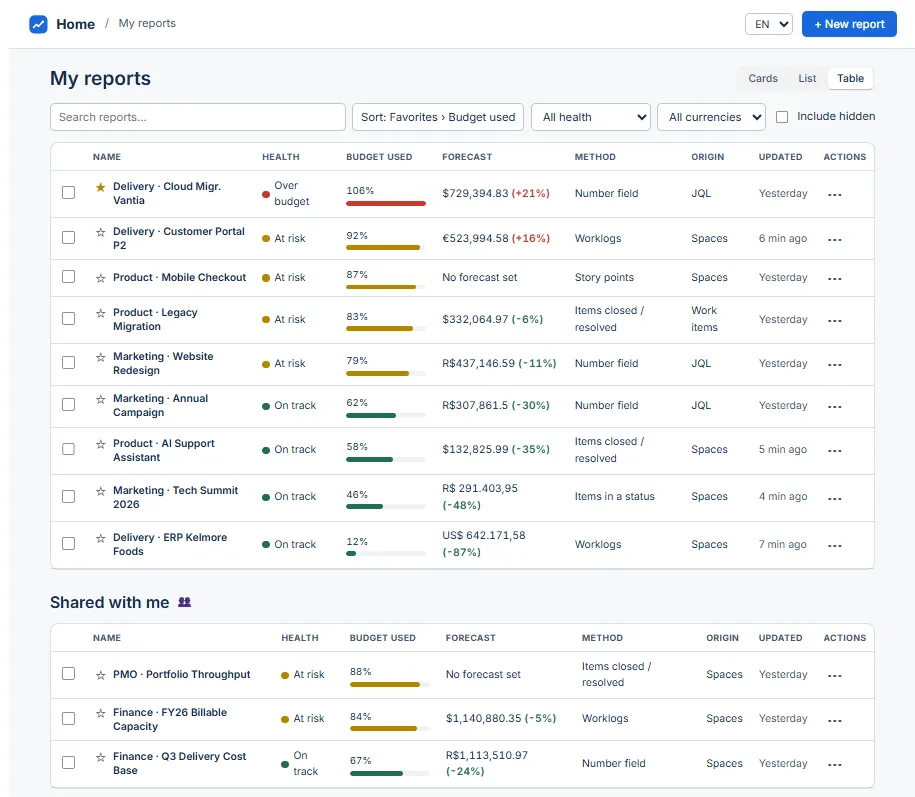
One screen showing which budgets are on track, at risk and over, sorted by risk.

Atlassian Marketplace app for Jira and Jira Service Management Cloud
Free trial
OnBudget is a Jira Cloud app for budget tracking and cost reporting. It turns work you already track in Jira into money. Pick story points, worklogs with rate cards, a numeric field, or counts of work items, set a budget in one of 18 currencies, and get spend, variance, and a forecast on your dashboard. It reads your Jira, working from the fields and worklogs already there.
OnBudget turns the work your team already tracks in Jira into money. It samples your data first and tells you what share of your work items carries each costing signal, so you know what your data can actually support before you build a budget on top of it.
Requirements and fit
The problem
The work is already in Jira. The money is in a spreadsheet somebody exports on Fridays, and by Monday it is wrong. Teams that do not use story points or timesheets, which is most of marketing, support and operations, do not appear in that spreadsheet at all.
How it works
01
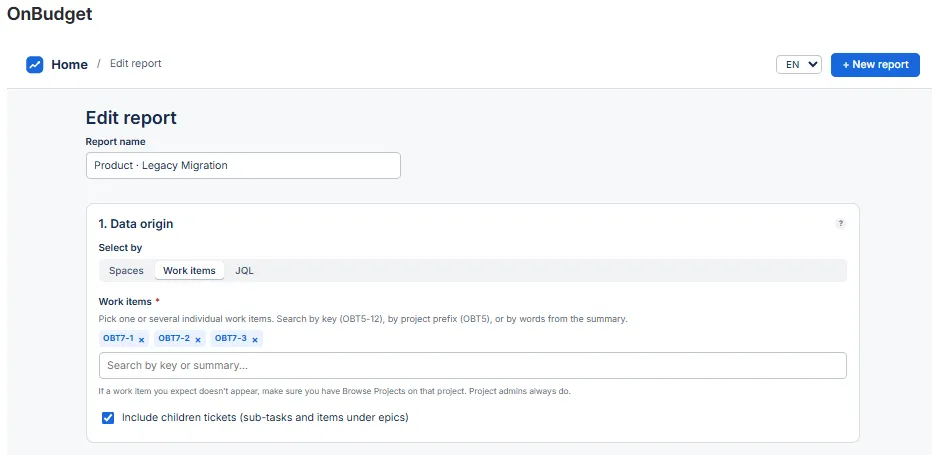
Point a report at whole spaces, at individual work items picked by key, prefix or summary text, or at a JQL query that is validated as you type. One toggle pulls in sub-tasks and everything under an epic.
02
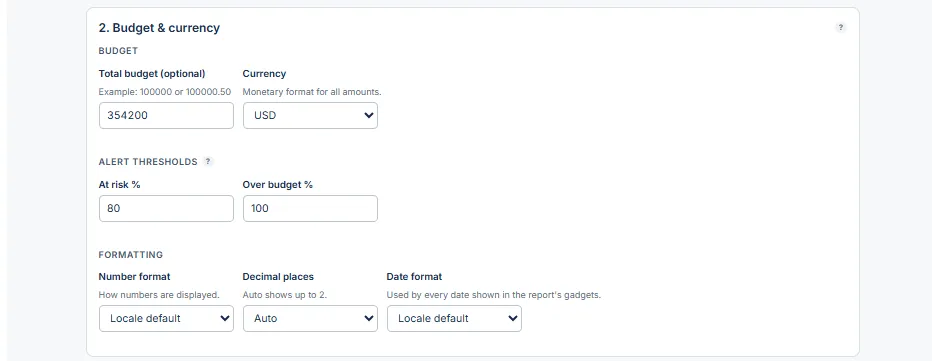
A total budget in any of 18 currencies, plus the two percentages that decide when a report turns amber and when it turns red. Number, decimal and date formats are set per report, so a Brazilian budget reads like one.
03
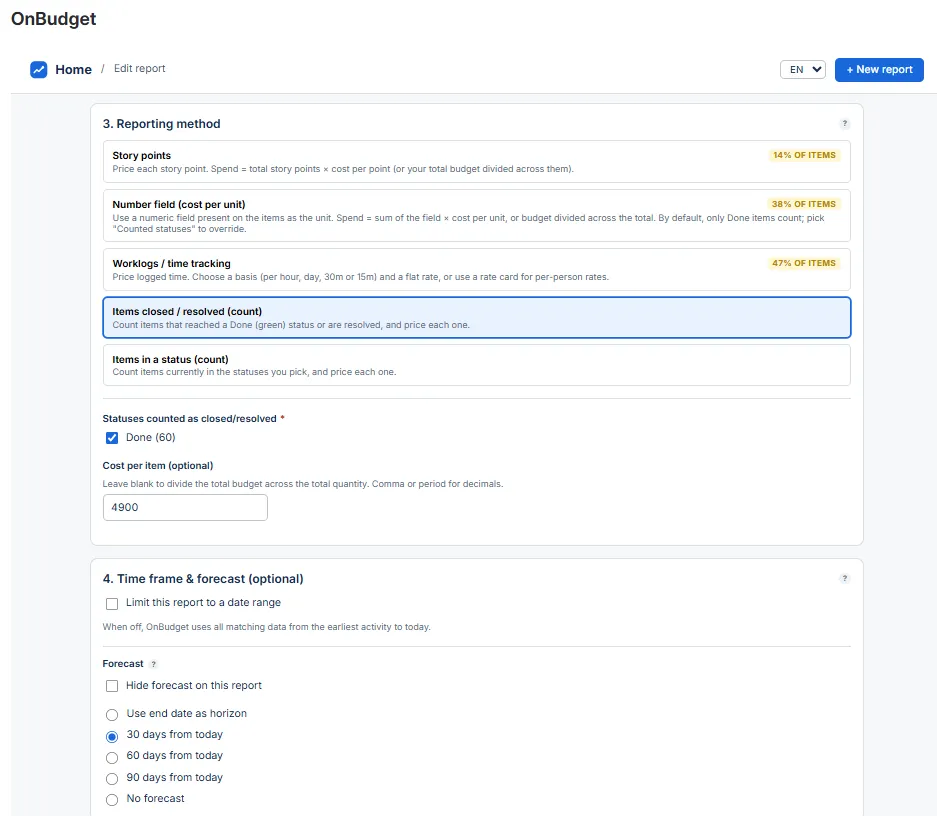
Five costing methods, and OnBudget samples your data first and tells you what share of your work items actually carries each one before you commit to it.
04
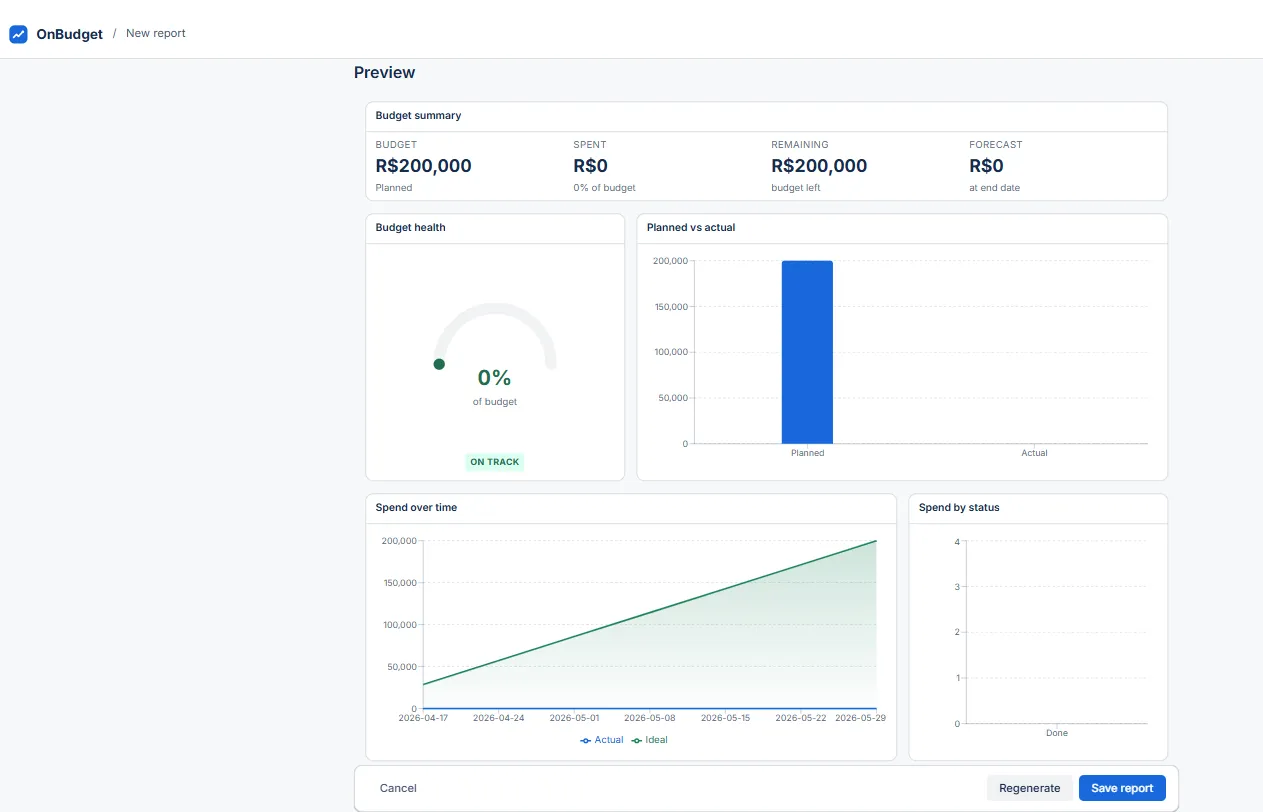
Limit the report to a date range, then forecast to the end date, to 30, 60 or 90 days out, or not at all. Preview the whole thing before you save it.
Costing
The hard part of costing Jira work is not the arithmetic. It is that every team measures something different, and half of them measure nothing at all. OnBudget samples your data and shows you what share of your work items carries each signal, before you build anything on top of it.
Each method shows its coverage across your data before you commit to it.
For teams that bill or cost time rather than estimate it.
Dashboards
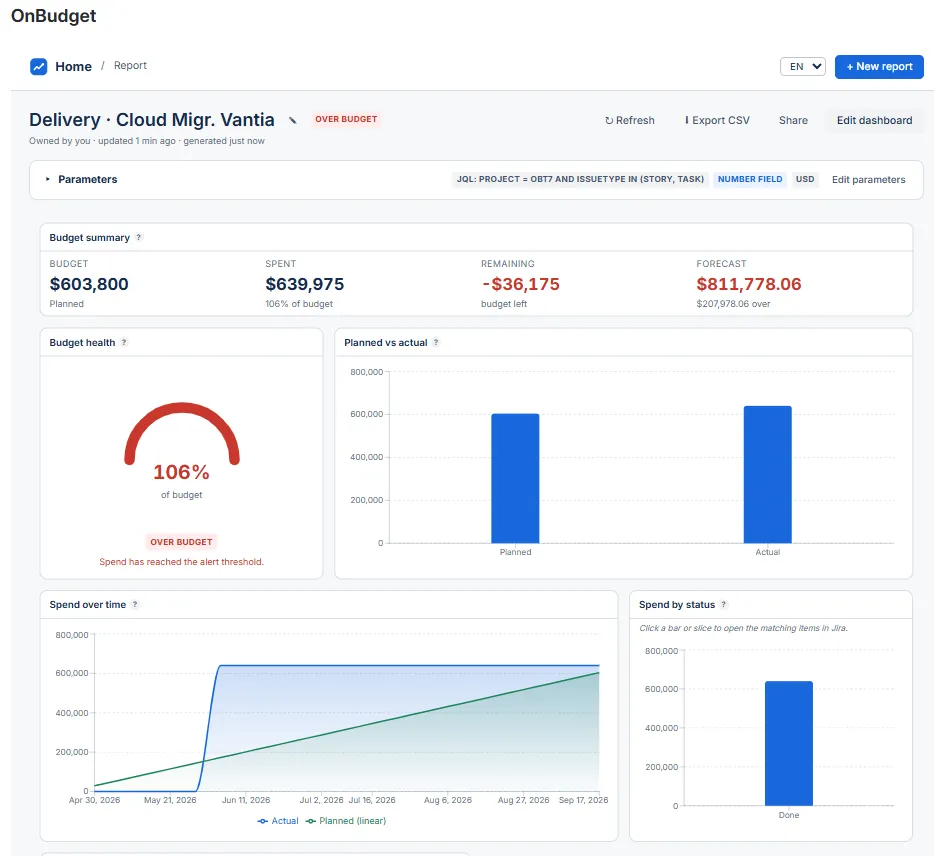
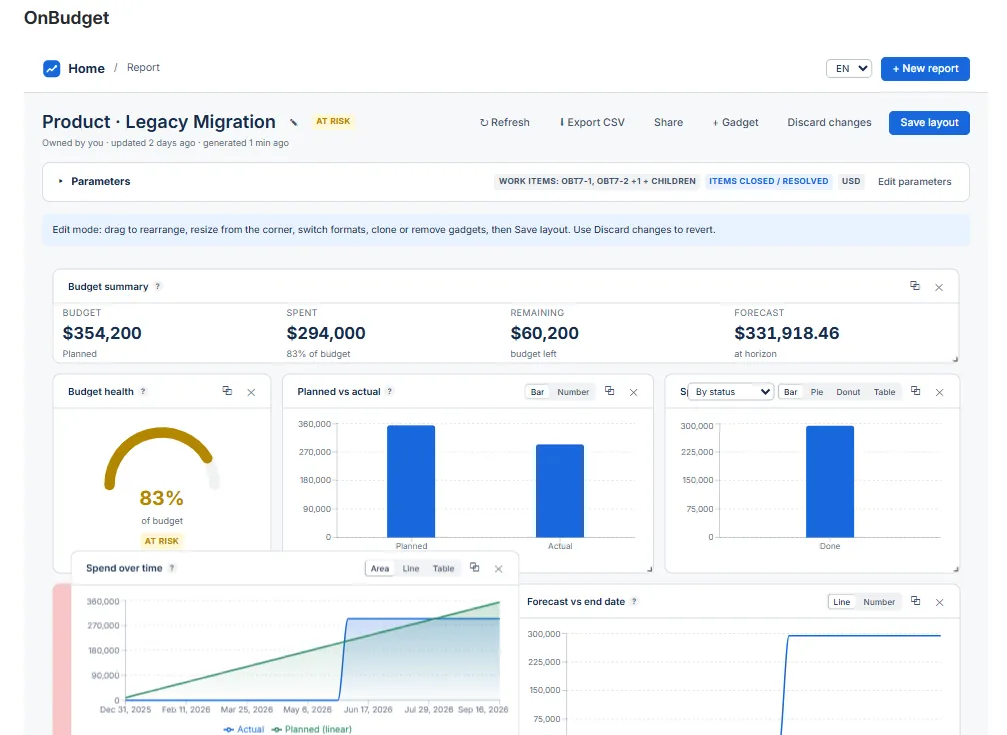
Nine gadget types, each with its own chart formats. Drag one to a new slot, resize it from the corner, clone it, remove it, or switch it between bar, line, area, pie, donut, table and plain number. Save the layout when it reads the way you think.
Sharing
When someone opens a report you shared with them, it is regenerated under their own Jira permissions, so nobody sees work items they could not already open in Jira. And if a viewer lacks access to part of the scope, the report says so on the page rather than showing a smaller number without explaining why.
At scale
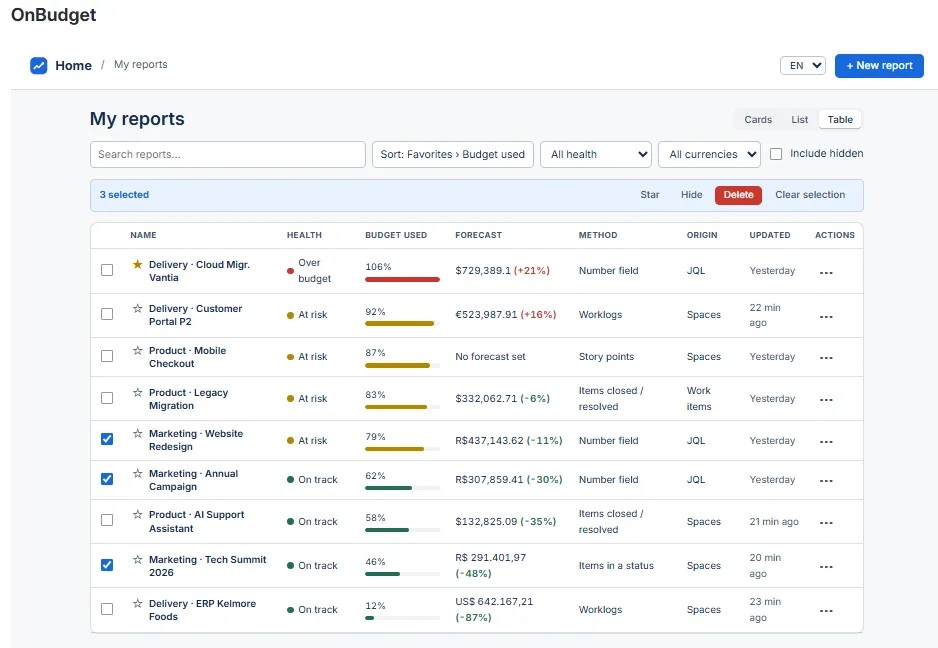
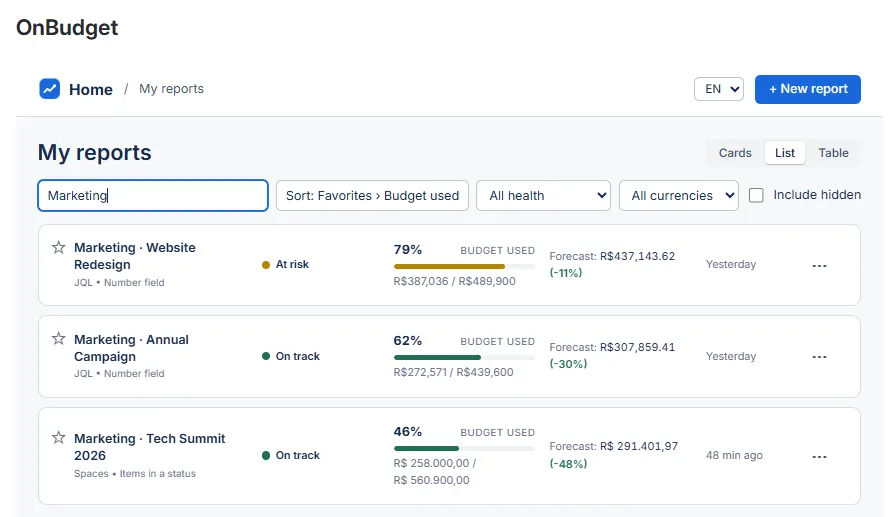
A budgeting tool is easy to like with three reports open and hard to live with at fifty. This is what the app gives you once a portfolio has grown.
Security and data
OnBudget keeps your report settings and nothing else. Every read runs with your own Jira permissions, and uninstalling purges everything it held.
Languages
The whole interface is available in English, Portuguese and Spanish, and each report carries its own currency, number format and date format. A budget in reais reads like a budget in reais, not like a US spreadsheet with the wrong separators.
Where it fits
Keep twenty delivery budgets visible without chasing twenty spreadsheets.
One screen showing which budgets are on track, at risk and over, sorted by risk.
Understand what a quarter of engineering work actually cost.
Worklogs priced by rate card, exported to CSV, reconcilable line by line.
Track a campaign budget for a team that has never used story points.
Cost per completed work item, with coverage confirmed before the report is built.
Questions
No. OnBudget reads what is already there: story points, worklogs, existing numeric fields, statuses and resolutions. There is nothing to add to a screen scheme and nothing to backfill, which is why a first report takes minutes rather than a change request.
Five signals. Story points priced per point, any numeric field priced per unit, worklogs priced by a rate card or a flat rate, work items closed or resolved priced per item, and work items sitting in chosen statuses priced per item. You can also leave the unit cost blank and let OnBudget divide the total budget across the total quantity.
Through rate cards. A card holds rates per user or per project role, plus a fallback hourly rate for authors it does not recognise. Project admins can define reusable worklog role presets from the project settings, so the same roles do not have to be rebuilt for every report.
Then count work items instead. OnBudget can price items closed or resolved, or items sitting in statuses you choose. This is the common case for marketing, support and operations, and the builder tells you what share of your data carries each signal before you pick one.
No, and it is not trying to. A time tracking app decides how hours get recorded. OnBudget reads whatever ended up in Jira worklogs and prices it, so if your team logs time through another app that writes to Jira, OnBudget costs those worklogs like any others. It also does not need them: story points, a numeric field or a count of work items work just as well when nobody logs time at all.
Eighteen ISO currencies, including USD, EUR, GBP and BRL. Each report is denominated in one currency and OnBudget does not convert between them, because an invented exchange rate is worse than no exchange rate. Number, decimal and date formats are set per report alongside it.
Yes, with users or with groups. A shared report is not a snapshot of your view. It regenerates under the viewer's own Jira permissions, so nobody sees work items they could not already see in Jira, and the report warns when a viewer lacks access to part of its scope.
Inside Atlassian. OnBudget runs entirely on Forge, which makes it eligible for the Runs on Atlassian program, and holds two read scopes on Jira plus its own app storage. It stores your report settings and never the content of your work items or the results of a report. Account and group identifiers are hashed before use as storage keys, and uninstalling purges everything.
Yes, as CSV with the per work item breakdown behind the totals. The file is generated in your browser, so the data does not leave Atlassian to produce it.
Two percentages you set per report. At risk defaults to 80 percent of budget consumed and over budget to 100 percent. They drive the health lozenge, the colour of the gauge, and the sort order on the home screen, so the reports that need attention rise to the top.
As far as you choose: to the report's end date, or 30, 60 or 90 days from today. You can also turn the forecast off. The projection is a linear run rate from the spend recorded so far, shown against the budget so any overrun or headroom is visible.
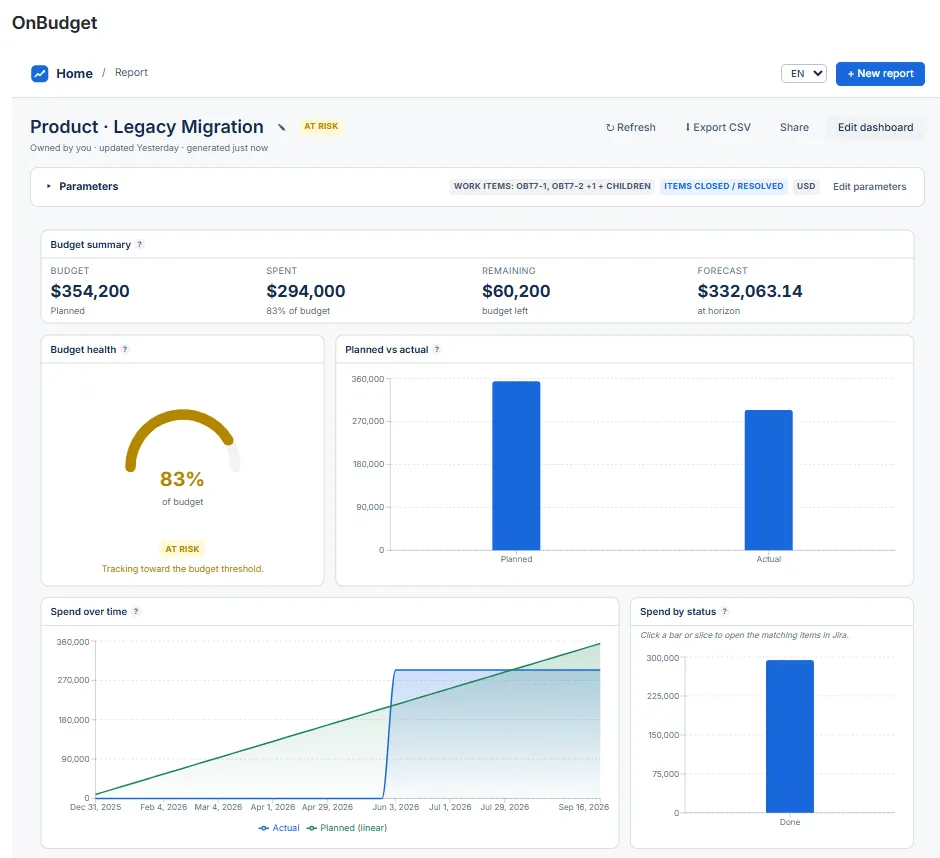
Yes. Every report carries a parameters row spelling out the exact scope, method and currency it used, and clicking a bar or slice in a breakdown opens the matching work items in Jira.
OnBudget is a paid app with a free trial, sold through the Atlassian Marketplace. See the listing for current pricing, which is where it stays accurate.
It is on the Atlassian Marketplace with a free trial, so you can point it at a real project and see your own numbers before you decide. If you would rather talk it through first, we answer in English, Portuguese and Spanish.
Our other apps
We use cookieless analytics by default. With your permission we also measure which of our pages and ads lead to an app install, using Google. Read the privacy policy