What does your Jira work actually cost?
Jira records what your teams did. It does not record what it cost. Here are the five signals most teams already have, how to turn each one into money, and how to tell which of them your data can actually support.

Jira records what your teams did. It does not record what it cost.
To cost work in Jira, price a signal your teams already produce. There are five: story points, logged time, a numeric field, a count of completed work items, and a count of items sitting in a given status. Multiply the signal by a rate, compare the result to a budget, and you have a cost report without asking anyone to fill in anything new.
Key takeaways
- Every costing method is a signal multiplied by a rate. The hard part is picking the signal, not the arithmetic.
- Check coverage before you commit. A method that only applies to 14 percent of your work items will produce a number that is confidently wrong.
- Teams with no estimates and no timesheets are not out of options. Counting completed work items is a legitimate method, and often the only honest one.
- A budget number with no scope attached cannot be defended. Write down what is in and out before you write down the total.
Why can’t Jira tell you what work costs?
Because money was never in scope. Jira models work: who is doing what, in which state, linked to what else. It has no concept of a rate, a budget, or a currency, and there is no field where the cost of a work item is supposed to live.
Most teams fill the gap with a spreadsheet: someone exports a filter on Friday, multiplies by something, and pastes the result into a deck. It is wrong by Monday, and it is wrong in a way nobody can audit, because the export is gone and the multiplication lived in a cell.
What signals do you already have?
More than you think. Almost every Jira space (Atlassian renamed projects to spaces in 2025, so “space” and “project” mean the same container) carries at least one of these:
| Signal | Where it comes from | Prices well when | Fails when |
|---|---|---|---|
| Story points | The estimate field on a work item | Teams estimate consistently and rarely re-estimate mid-sprint | Half the backlog is unpointed, or points mean different things per team |
| Logged time | Worklogs | People actually log time, and roles differ enough in cost to matter | Logging is patchy, or everyone is costed at the same rate anyway |
| A numeric field | Any custom number field already on the work item | Someone is already recording a quantity: licences, seats, units, hours quoted | The field is optional and half-empty |
| Items closed or resolved | Resolution and status history | Work items are roughly comparable in size | One work item is a typo fix and the next is a migration |
| Items in a status | Current status | You are costing a stage rather than a finished thing | Items sit in that status for wildly different lengths of time |
Notice that only two of those five require anyone to have adopted a practice. The other three work off things Jira records whether or not your teams cooperate.
How do you turn story points into money?
Take the fully loaded cost of the team for a period, divide by the points they completed in that period, and you have a cost per point. Multiply forward.
The number is rougher than it looks, and that is fine. A cost per point is a planning instrument, not an invoice. It is useful precisely because it smooths over the fact that some stories were harder than their estimate and some were easier. What it cannot survive is a backlog where a third of the items have no estimate at all: those items become free, and free work items make budgets look healthy right up until they do not.
What if your team has no estimates and no timesheets?
Then count things. This is the case for most marketing, support and operations teams, and it is the case that gets ignored because it feels less rigorous than a timesheet.
It is not less rigorous. If a support team closed 340 tickets last quarter and cost 170,000 to run, each ticket cost roughly 500. That number is defensible, reproducible, and derived entirely from data the team was already generating. It is considerably more honest than a timesheet nobody fills in accurately.
The failure mode is heterogeneity. If your work items range from a five-minute correction to a three-week project, a flat cost per item is meaningless. The fix is to narrow the scope until the items are comparable: cost a single work type, or a single space, rather than everything at once.
How do you price logged time fairly?
With a rate card, not a single blended rate.
A blended rate assumes everyone costs the same, which is never true and gets less true as a team grows. A rate card holds a value per person or per role, so a senior engineer’s hour and a junior’s hour do not silently average out. Keep a fallback rate for authors the card does not recognise, otherwise a contractor who joined last week quietly costs zero.
Decide your time basis explicitly too. Logged time comes back in seconds; whether you price it per hour, per day, or in fifteen-minute blocks changes the result more than most people expect when the underlying logs are rounded.
What does “at risk” actually mean?
Whatever you decide it means, which is why you have to decide before the number matters.
The convention worth adopting is two thresholds: one where a budget turns amber, one where it turns red. Eighty percent and one hundred percent of budget consumed is a reasonable default, but the useful part is not the specific numbers. It is that a threshold set in advance is a commitment, and a threshold set after seeing the number is a rationalisation.
How do you forecast from a partial quarter?
Linearly, and say so.
Take the spend recorded so far, divide by the elapsed portion of the period, and extend to the horizon. It assumes the run rate holds, which it will not exactly, and that assumption is the point: a linear forecast is a statement of what happens if nothing changes. When the projection lands past the budget line, the conversation is about what will change, not about the model.
Pick a horizon deliberately. To the end date is right for a fixed-scope project. Thirty, sixty or ninety days out is right for continuous work with no end date, where forecasting to an arbitrary finish line just moves the error around.
Where to start
Start with one budget, not twenty.
Pick a space where somebody has actually asked what it costs, look at what signal that team already produces, and cost that. Write down the scope in a sentence before you write down the total, because a number without a scope is the thing that gets challenged in the meeting and cannot be defended.
We built OnBudget to do exactly this inside Jira. It samples your data first and shows you what share of your work items carries each of the five signals before you commit to one, then tracks budget against actual with the thresholds and the forecast you chose. If you are auditing the wider picture first, Field Scout is free and shows you what your custom fields are actually being used for, which is usually how you discover that the numeric field you were about to cost against is only filled in on a third of your work items.
Whichever way you go: cost one thing, honestly, before you try to cost everything.
Want this without the spreadsheet?
OnBudget turns the work your team already tracks in Jira into budgets, forecasts and cost reports. It works with the fields your team already fills in, and it reads your Jira rather than editing it.
Related reading
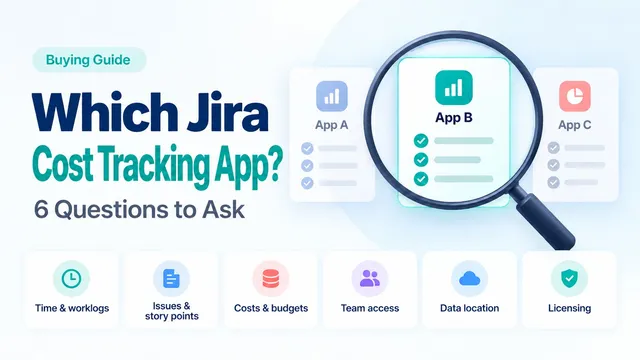
How to choose a cost tracking app for Jira
A buying guide written by the team behind OnBudget. Six criteria phrased as questions a buyer would ask, a table comparing five approaches rather than five products, and a plain account of where OnBudget fits and where it does not.
Jira's 700 custom field limit is not a site-wide cap
Jira Cloud caps custom fields at 700 per space, not across your whole site, and one field can count toward several spaces at once. What Atlassian's guardrails actually say, what happens when a space reaches the line, and the order to audit in.
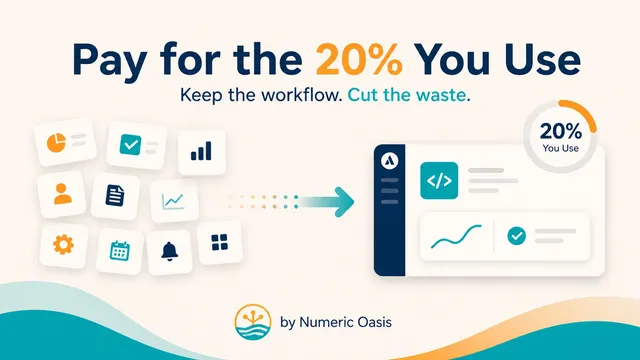
Pay for the 20% You Use: Shrinking Your Atlassian App Footprint Without Losing the Workflow
Most Atlassian Marketplace bills pay for features nobody uses. An honest usage audit and a focused custom Forge app turn pay-per-seat-forever into pay-once-you-own-it, with a better fit for your team.